
Area Chart
- Wix Campaign
Product media
Screenshots
1 of 5



Overview
About this App
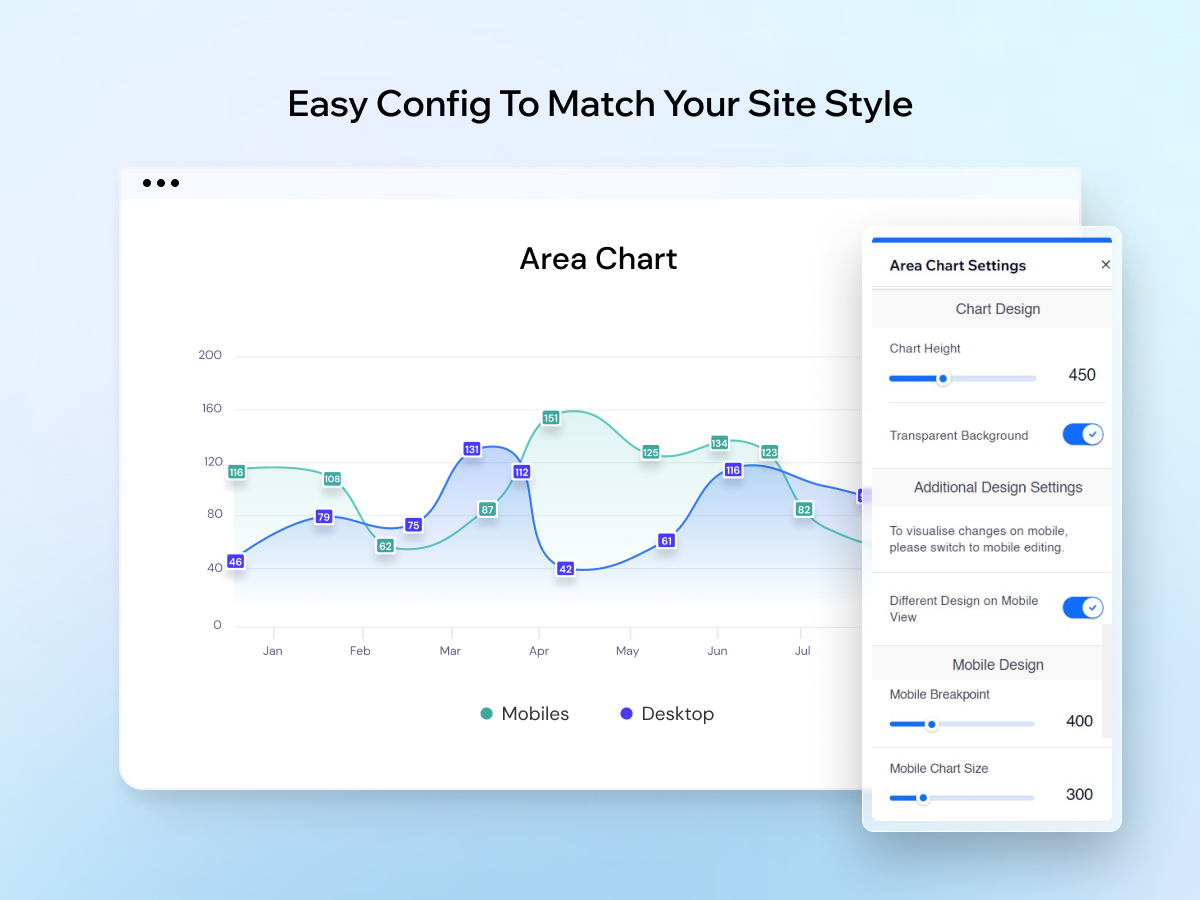
Area Chart adds a clear area chart to any page of your site, so visitors see trends and totals at a glance instead of reading rows of numbers, such as sales over time or monthly visitors. Enter your data points and values by hand in the settings panel, or feed the chart from a JSON link or with Velo code so it shows the numbers you already keep elsewhere. Add several lines to one chart to compare series side by side, and give each line a solid or dashed stroke. Adjust the chart style so the graph fits the look of your brand. Visitors can hover over the chart to read the exact value at each point. It is a simple way to turn your numbers into data visualization that is easy to understand.
What the listing highlights
- Show trends at a glance: turn rows of numbers into an area chart your visitors read easily
- Keep your data current: type values in the settings panel, or feed the chart from a JSON link or Velo code
- Compare series: add several lines to one chart and give each a solid or dashed stroke
- Match your design: adjust the chart style so the graph fits the look of your brand
Additional product media
Promotional media
Reviews
Official Wix marketplace summary
Wix Marketplace feedback
No reviews yet.
Plan comparison
Pricing & Plans
Premium
$1.49 / month
$17.88 billed yearly Save 50% yearly$2.99 / month
- Showcase Your Line Charts With Ease
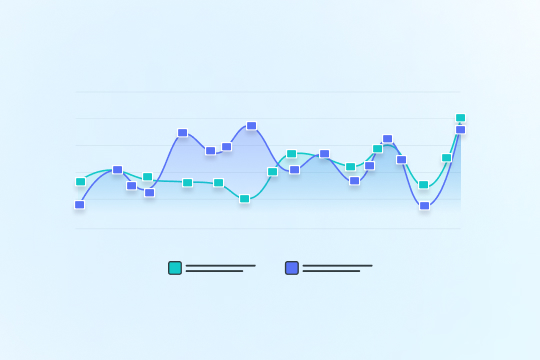
- Various Types of Area Charts
- Easy Config To Match Your Site Style
Detailed App featuresCompare all 3 structured features
| Feature | Paid planPremium |
|---|---|
| Showcase Your Area Charts With Ease | Included |
| Easy Config To Match Your Site Style | Included |
| Various Types of Area Charts | Included |