
Analytica Business Analytics
Product media
Screenshots
1 of 6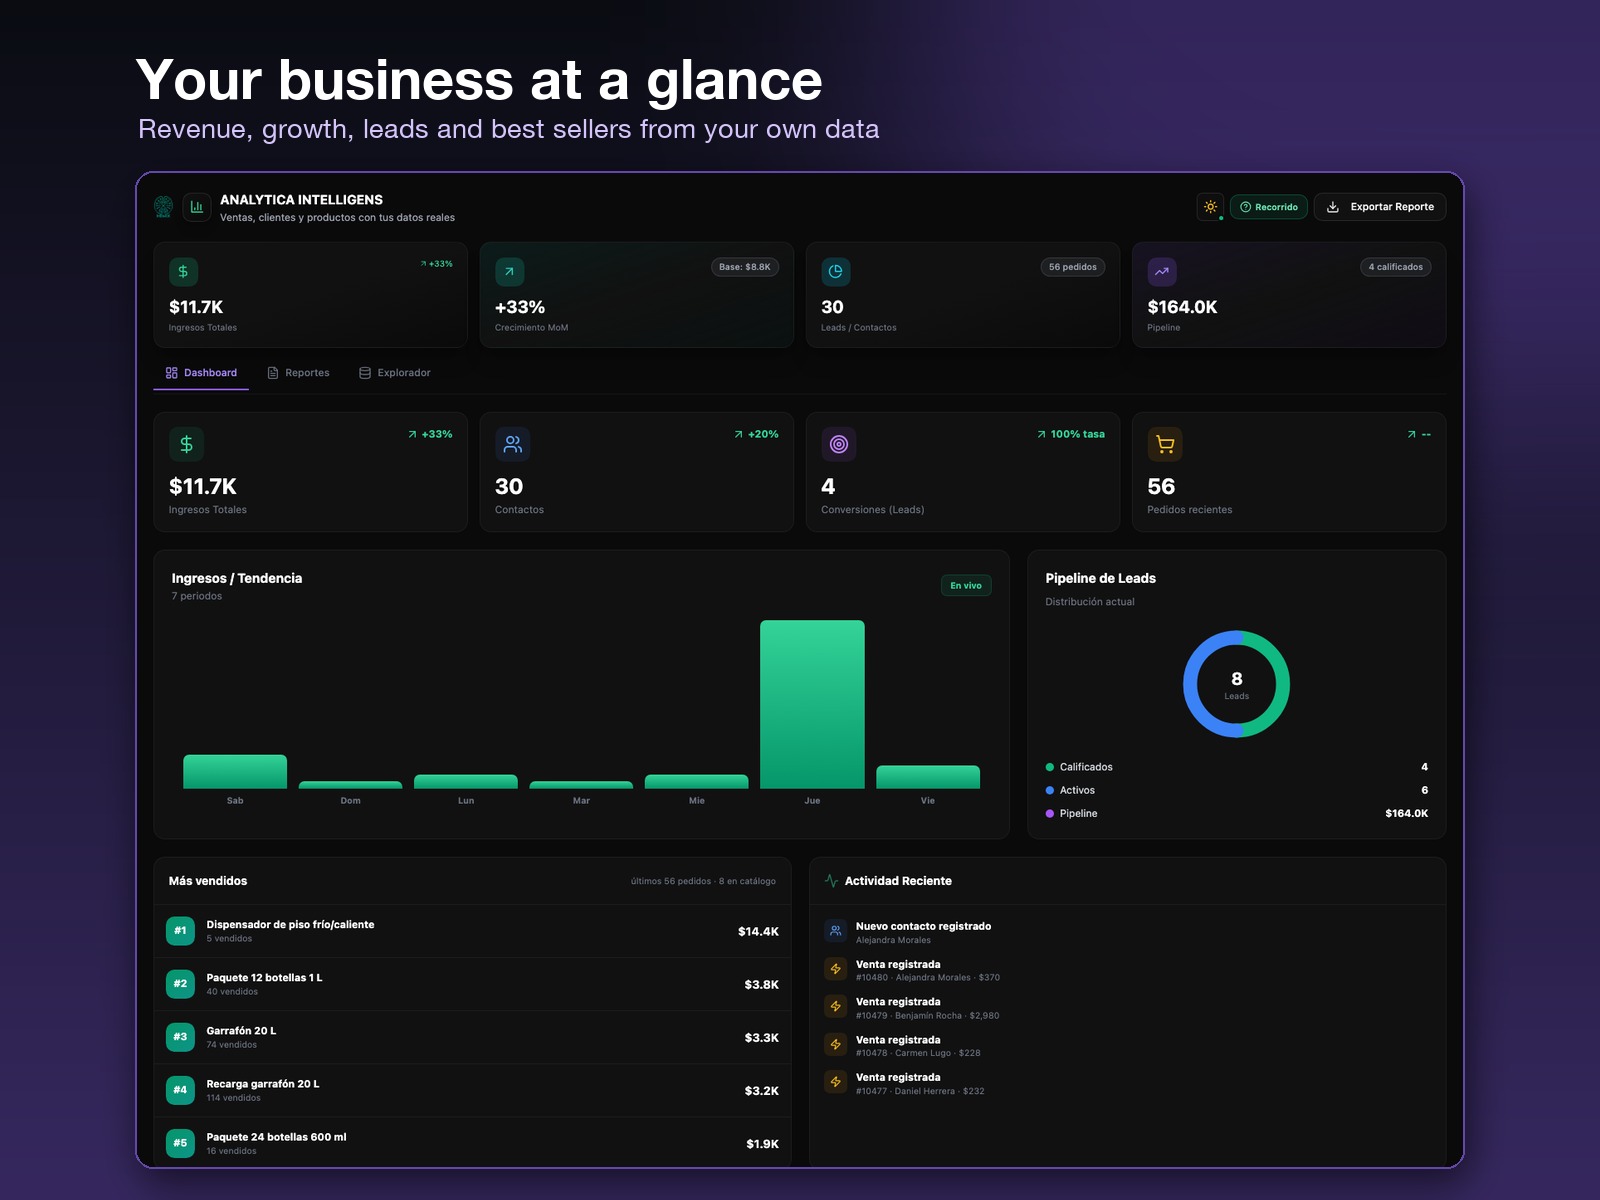
Overview
About this App
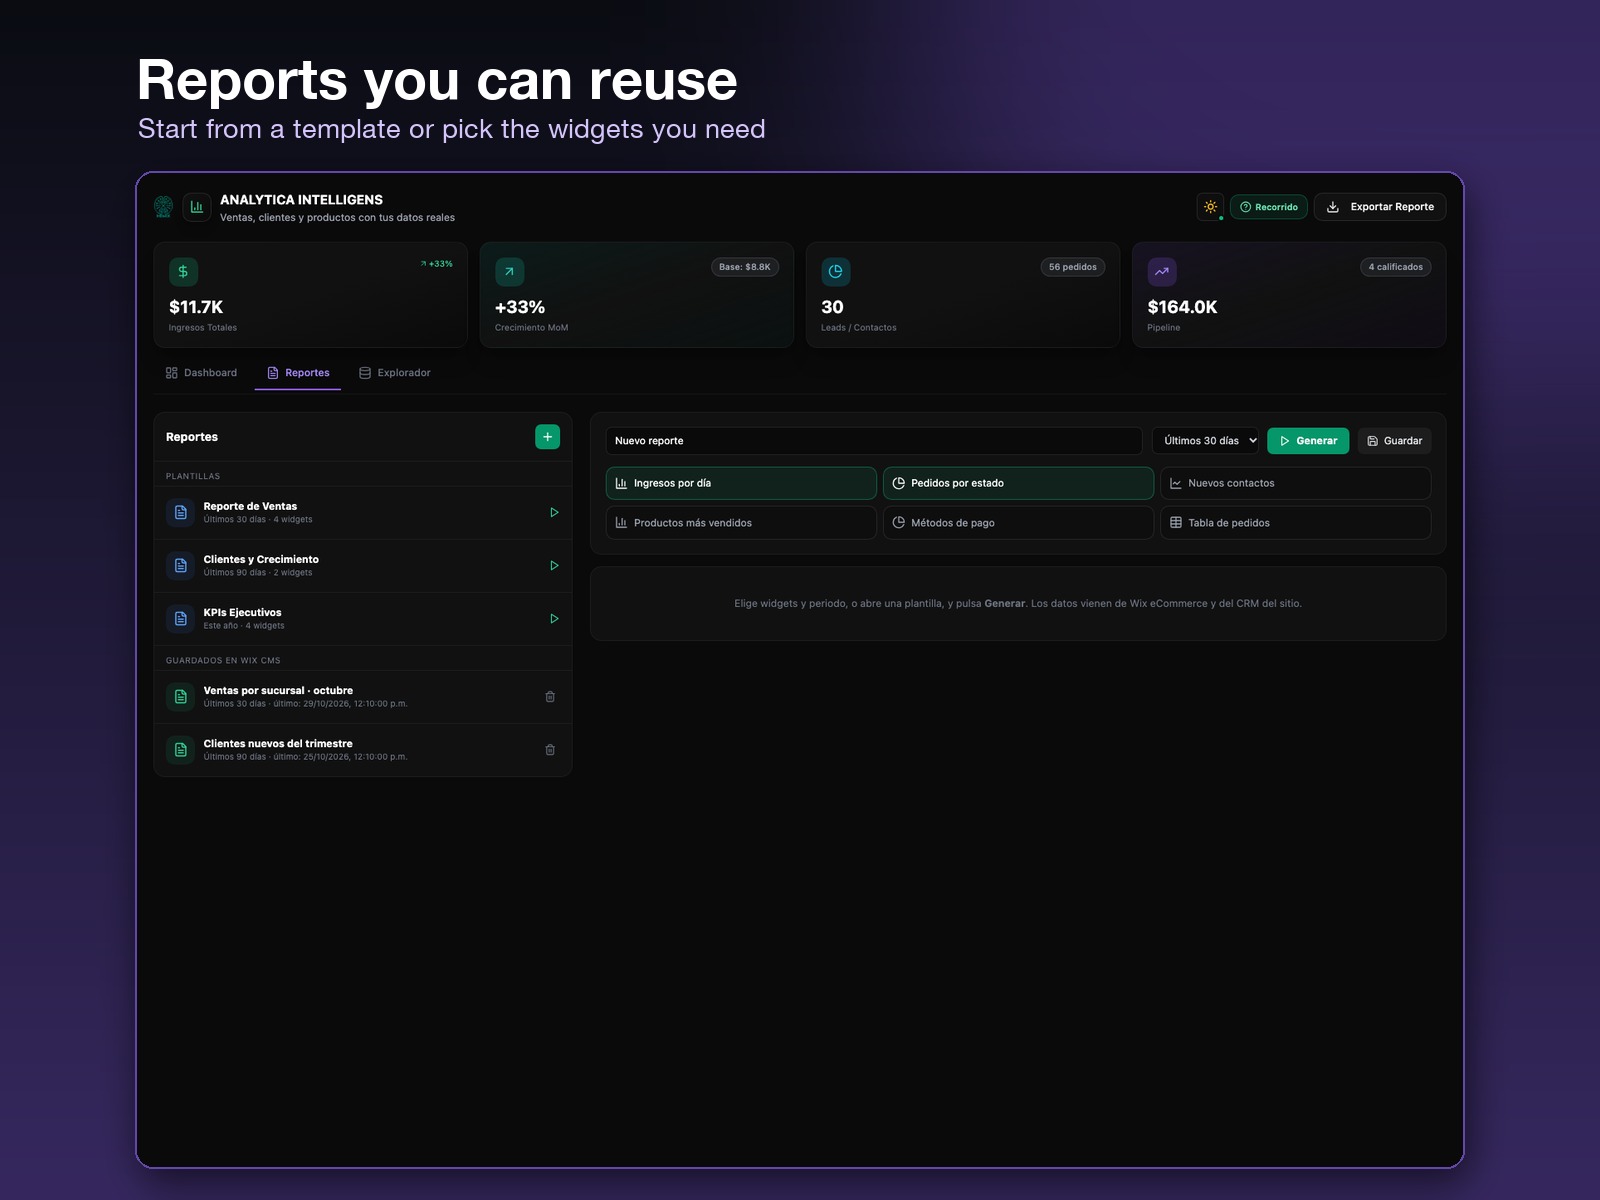
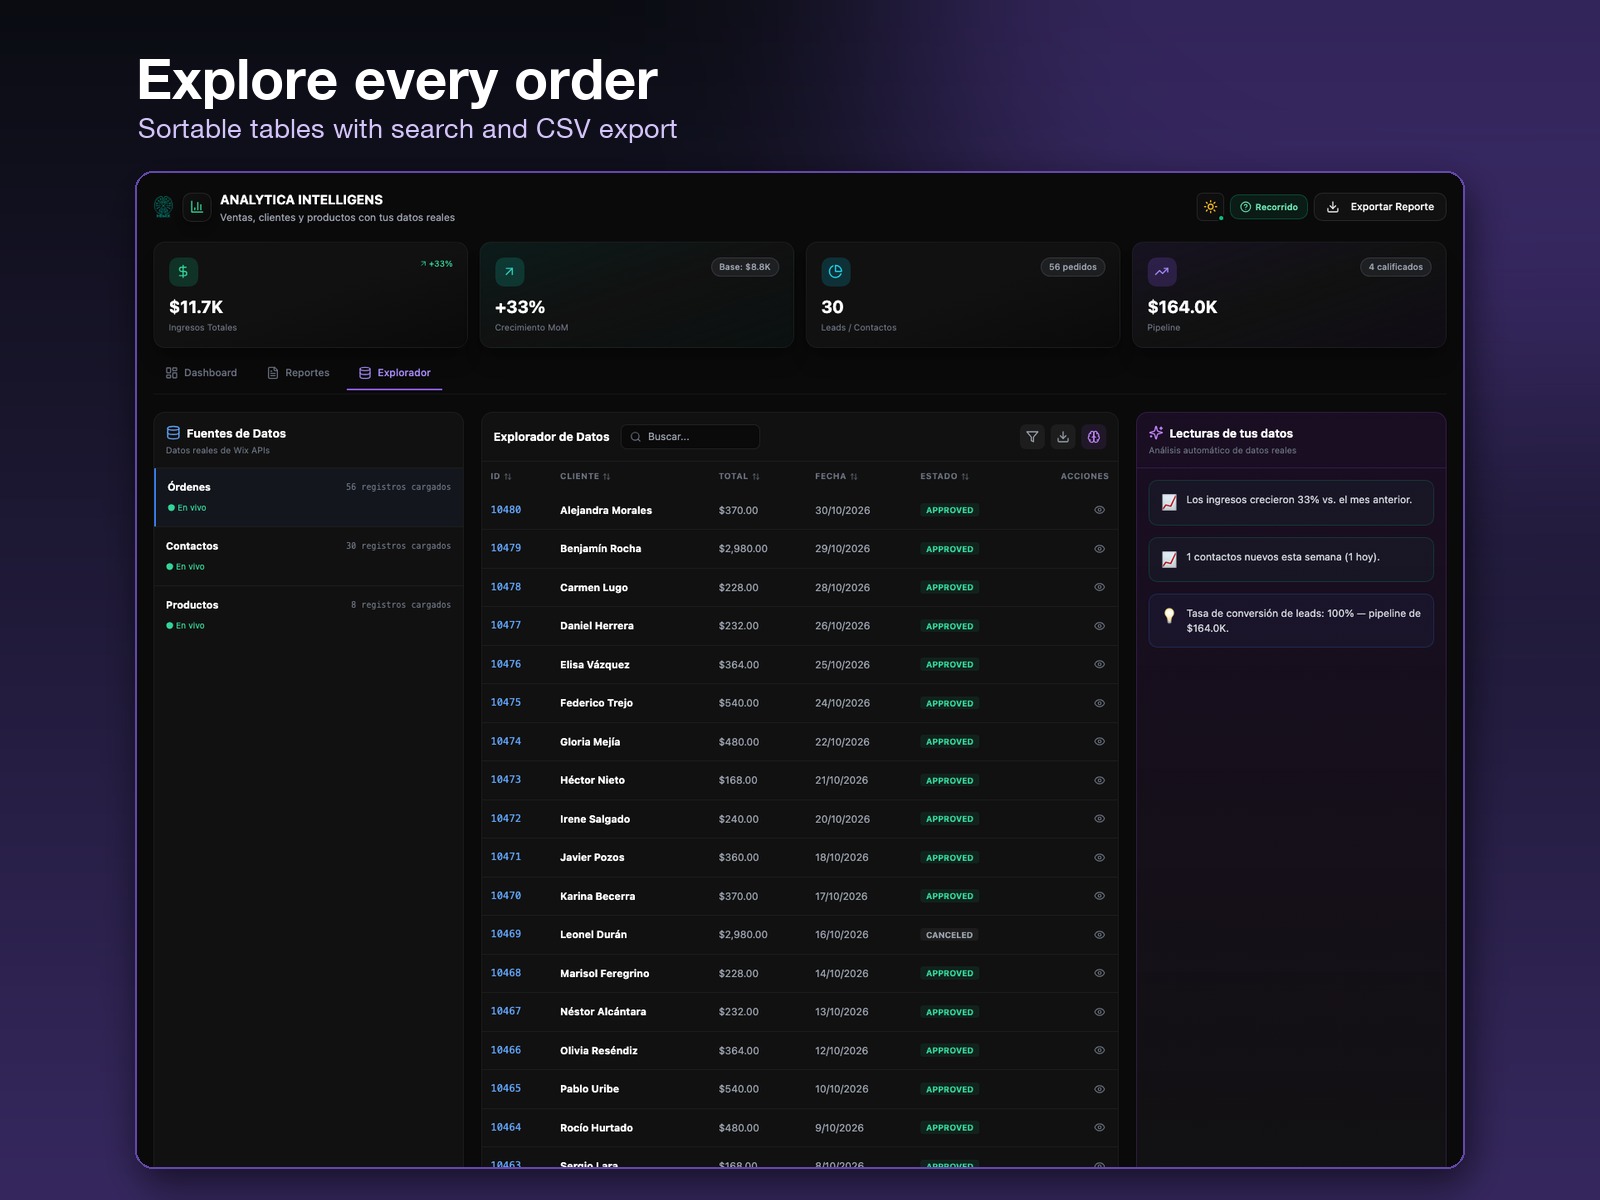
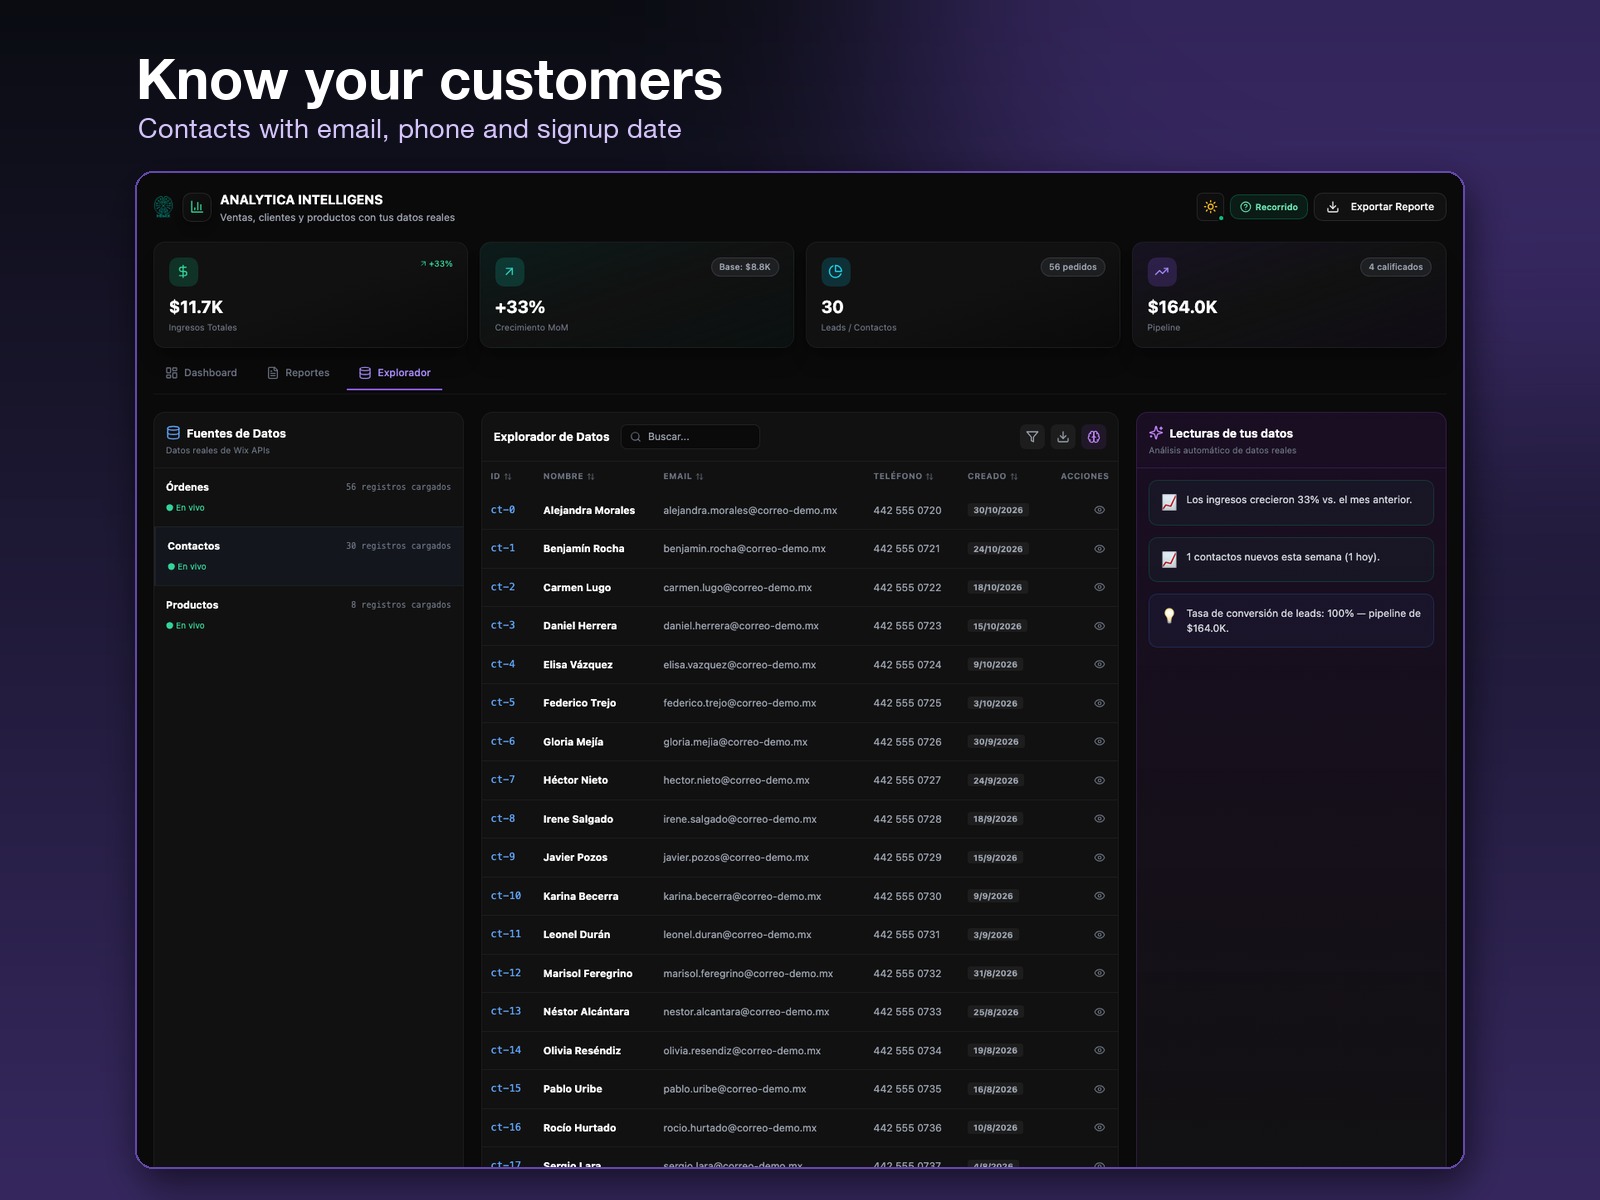
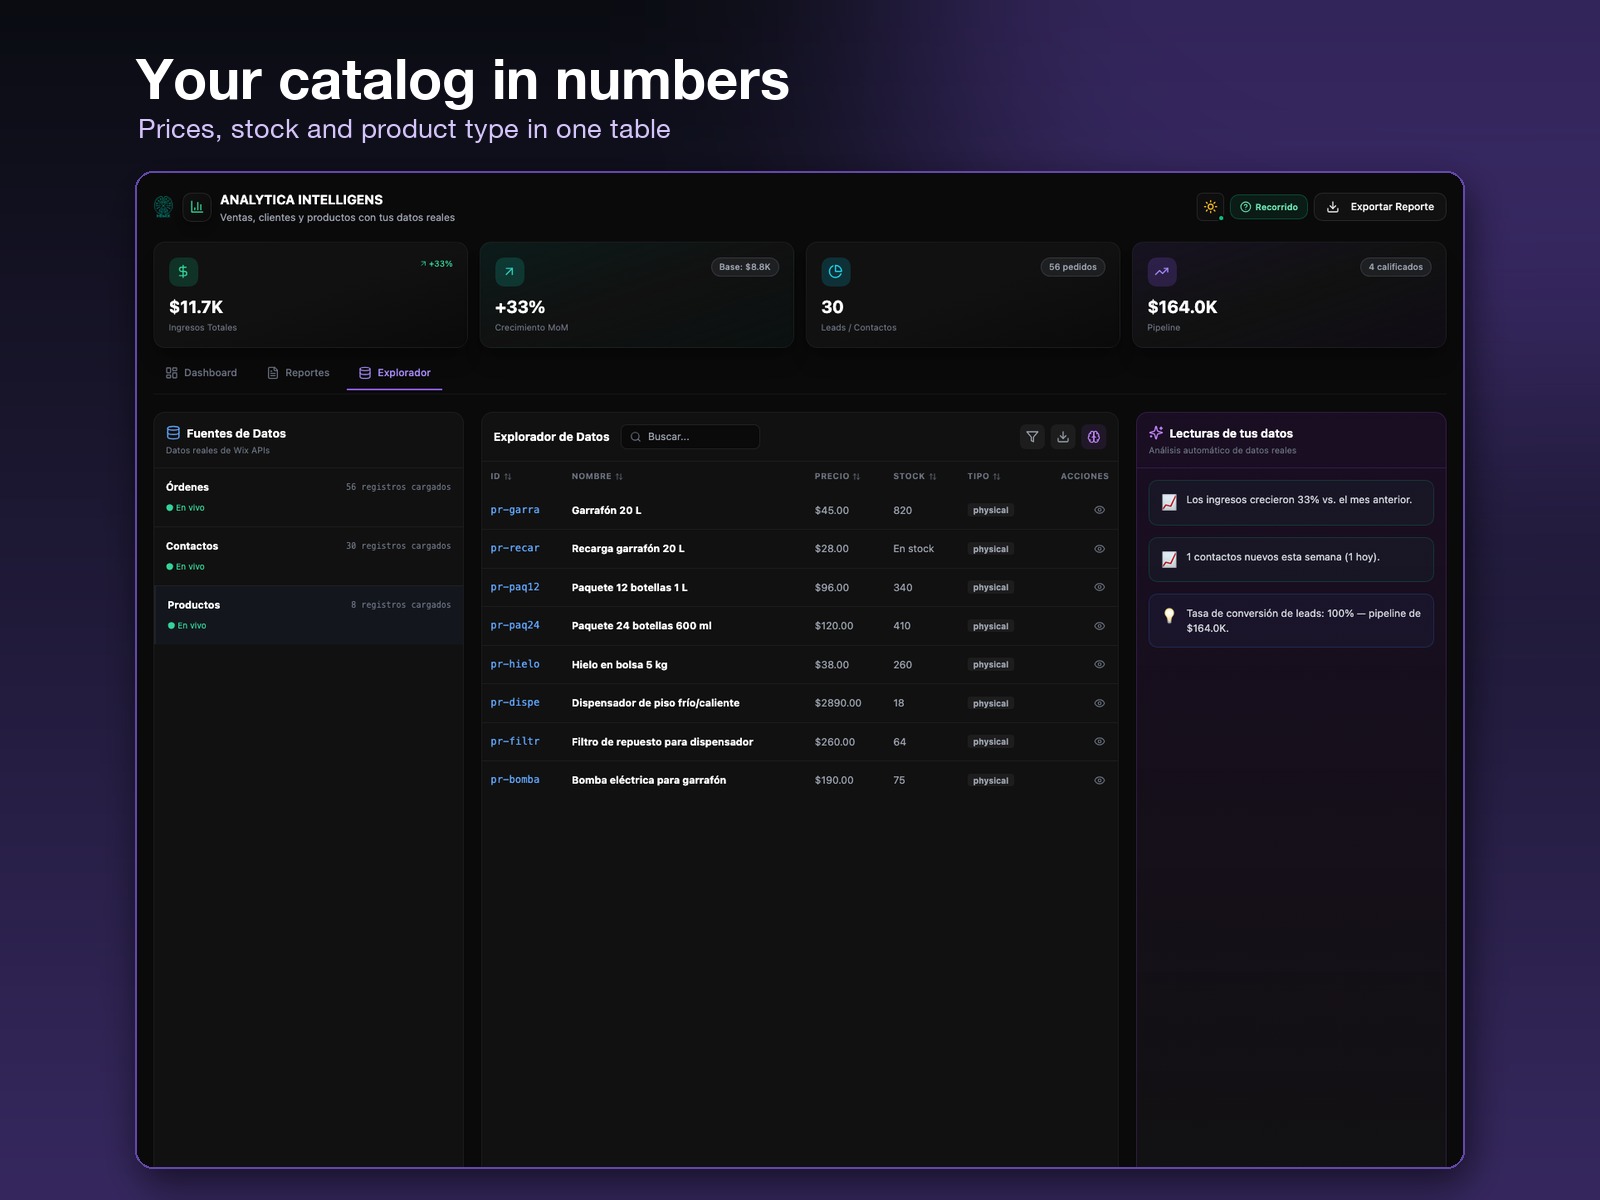
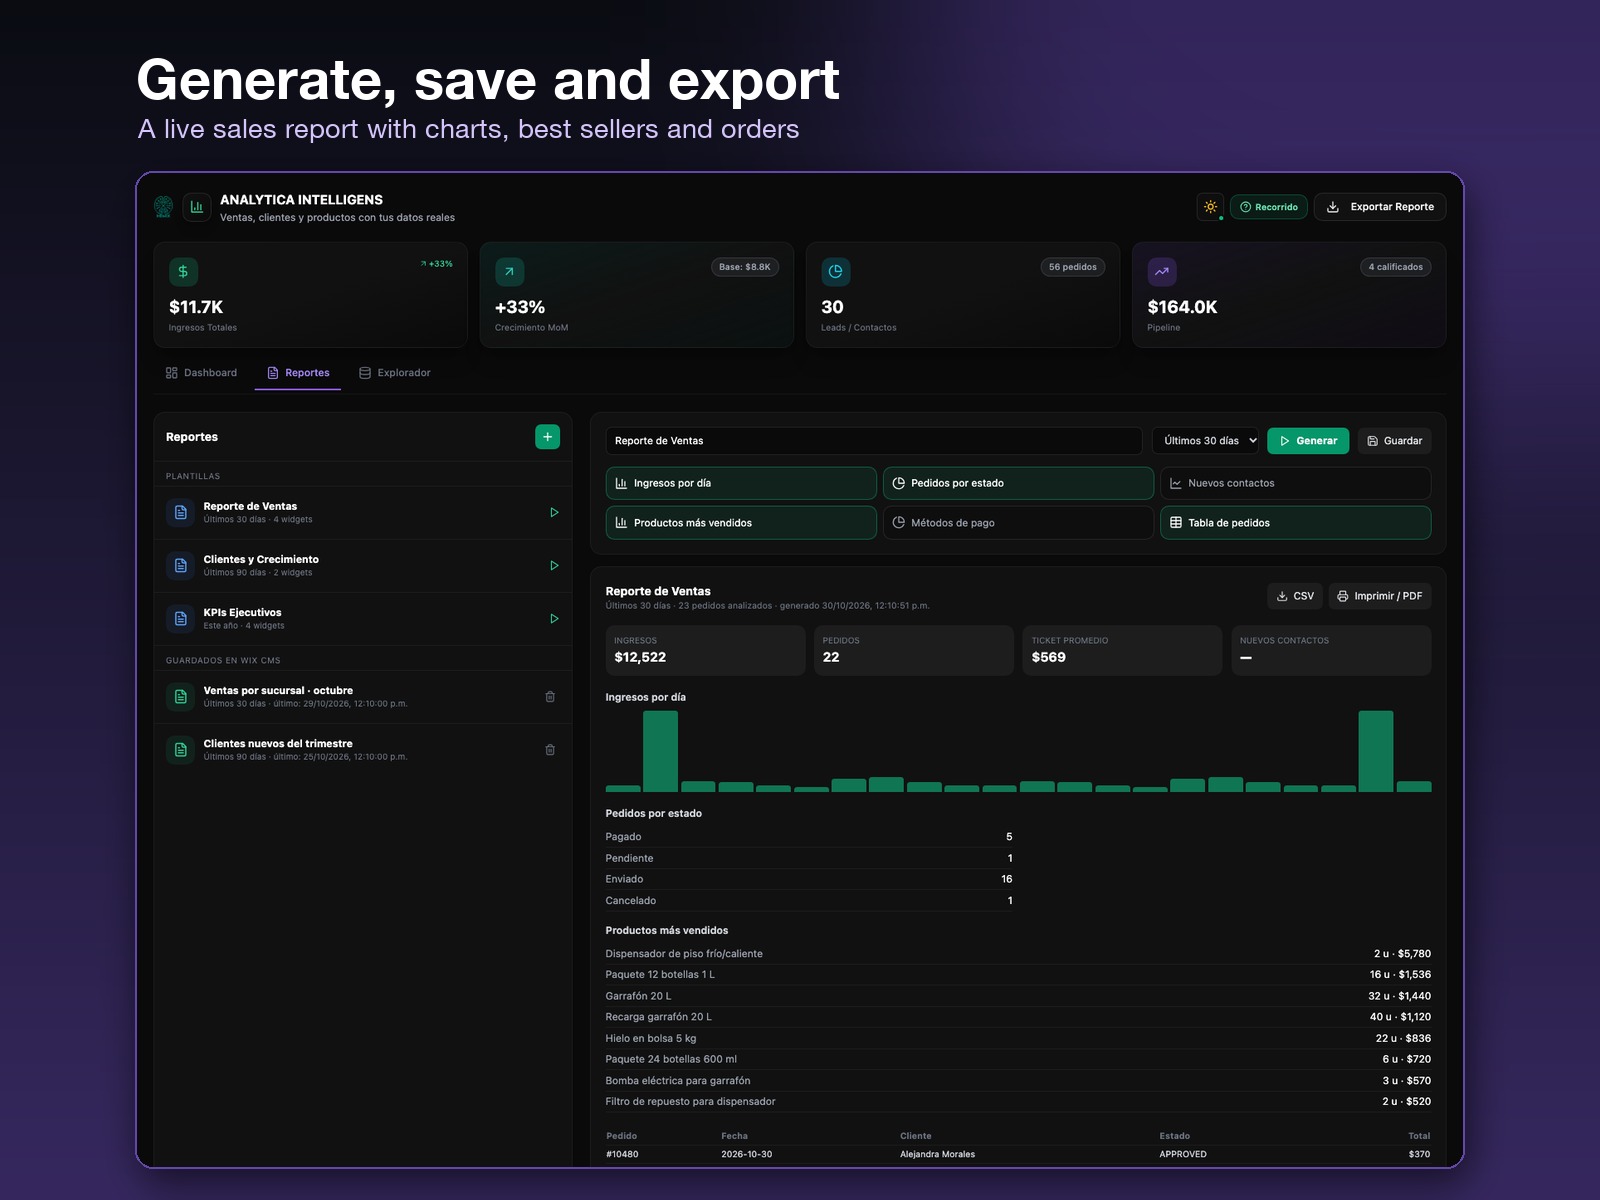
Analytica turns the orders, contacts and products of your site into numbers you can act on. The dashboard shows this month's revenue and its change versus last month, contacts, qualified leads and pipeline value, a seven-day revenue chart, your best-selling products by units and revenue, and the latest activity. Reports: start from a template (sales, customers and growth, executive KPIs) or build your own with the widgets you need: revenue by day, orders by status, new contacts, best sellers, payment methods and an orders table. Pick the period, generate the report with live data, save it to run again later, and export it to CSV or print it as PDF. The data explorer lists your orders, contacts and products in sortable tables with search and CSV export, next to automatic readings of your numbers, such as revenue growth, new contacts this week, pending bookings or quotes and lead conversion. Every figure is calculated from records in your own site. When there is no data yet, the screen says so instead of showing estimates. Analytica installs the free Atlas engine, which keeps your data in your own site. Interface in Spanish.
What the listing highlights
- Revenue, growth and pipeline from your own data
- Best-selling products by units and revenue
- Reports you save, re-run and export to CSV
- Explore your orders, contacts and products
Reviews
Official Wix marketplace summary
Wix Marketplace feedback
No reviews yet.
Plan comparison
Pricing & Plans
Starter
$29 / month
$348 billed yearly Save 19% yearly$36 / month
- Dashboard, reports and explorer
- Saved reports and CSV export
- Up to 3 dashboard users
Pro
$58 / month
$696 billed yearly Save 19% yearly$72 / month
- Everything in Starter
- Up to 10 dashboard users
- For growing teams
Enterprise
$145 / month
$1,740 billed yearly Save 19% yearly$179 / month
- Everything in Pro
- Unlimited dashboard users
- For businesses with several branches